


Forex Trading: The Ascending Triangle Pattern
Ascending Triangle Pattern in Forex Trading: A Comprehensive Guide
The ascending triangle pattern holds significant value in forex trading as a widely recognised chart formation.
This comprehensive guide will delve into ascending triangles, explore their characteristics, discuss effective trading strategies, and highlight their importance in forex trading.
By mastering the art of ascending triangles, traders can enhance their technical analysis skills and potentially identify profitable trading opportunities in the dynamic forex market.
Understanding the Ascending Triangle Pattern
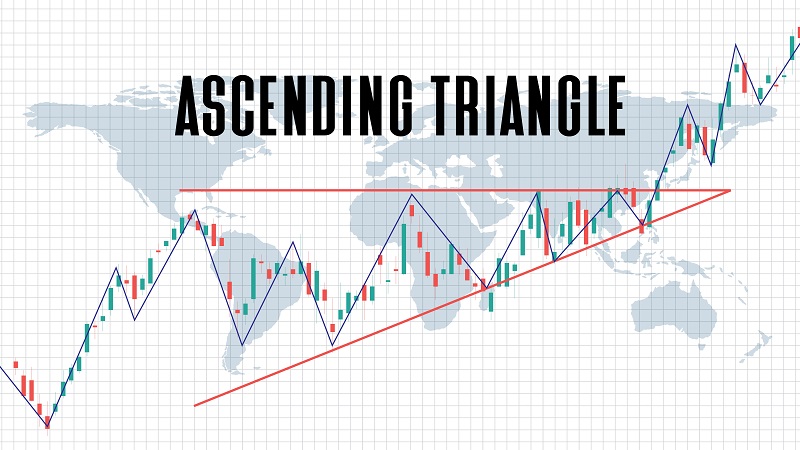
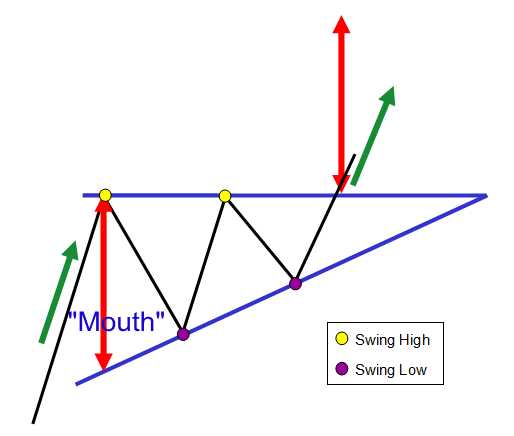
An ascending triangle is a technical chart pattern characterised by a horizontal resistance line that connects multiple swing highs and a rising trendline created by connecting ascending swing lows.
The convergence of these lines forms a triangular shape.
Traders often monitor triangle patterns for potential breakouts, which can occur in an upward or downward direction.
Characteristics of Ascending Triangle Patterns
Understanding the Ascending Triangle Pattern essential elements is crucial to effectively recognise and trade ascending triangles.
Here are the main features:
1. Trendline Formation
Ascending triangles require at least two swing highs and two swing lows to form the trendlines.
These swing highs and lows represent vital price action levels and are essential for drawing accurate trendlines.
2. Continuation Pattern
Ascending triangles are considered continuation patterns because the breakout tends to occur in the same direction as the prevailing trend before the pattern’s formation.
However, it is essential to note that this is not always the case.
Traders should remain vigilant and consider other factors for confirmation.
3. Entry and Exit Points
Long trades are typically initiated when the price breaks above the upper trendline, indicating a potential upward breakout.
On the other hand, short trades are triggered when the price breaks below the lower trendline, signalling a potential downward breakout.
4. Stop Loss Placement
Placing a stop loss outside the opposite side of the pattern from the breakout point helps manage risk and protect against potential losses.
This strategic placement ensures that the trade is exited if the breakout turns out to be a false signal or the price reverses.
5. Profit Target Calculation
Traders can estimate a profit target by measuring the triangle’s height at its thickest point and adding or subtracting it from the breakout price.
This calculation roughly estimates the potential price movement after the breakout.
Significance of Ascending Triangle Patterns
Ascending triangles hold great importance for forex traders in several ways:
1. Continuation of Trends
As continuation patterns, ascending triangles indicate the potential continuation of the existing trend.
This makes them valuable for trend-following strategies, allowing traders to align their trades with the prevailing market direction.
2. Volume Confirmation
Increasing volume during a breakout from the pattern confirms the move’s strength and provides additional validation for traders.
Higher volume suggests higher market participation, indicating the breakout’s potential stronger momentum and reliability.
3. Support and Resistance Levels
The upper trendline of the ascending triangle pattern acts as a resistance level, representing a level where selling pressure may be concentrated.
In contrast, the rising lower trendline acts as support, showcasing the psychological battle between buyers and sellers.
Traders observe these levels for potential price reactions.
4. Trading Psychology
Ascending triangles reflect the underlying psychology of market participants.
Buyers push the price higher until it encounters resistance at the upper trendline.
At the same time, sellers attempt to bring it back down.
The interaction between these two groups shapes the price movement within the pattern.
Trading Strategies for Ascending Triangle Patterns
To effectively trade ascending triangles, traders can employ the following strategies:
1. Breakout Trading
Wait for a clear breakout above the upper trendline or below the lower trendline to initiate a trade in the direction of the breakout.
Traders should exercise patience and wait for confirmation before entering a position.
2. Volume Confirmation
Confirm the breakout with increased volume, indicating higher market participation and potentially stronger momentum.
Higher volume during the breakout enhances the reliability of the pattern and provides additional confidence for traders.
3. Stop Loss Placement
Position the stop loss outside the pattern opposite the breakout to limit potential losses.
Placing the stop loss beyond the pattern helps avoid premature exits due to minor price fluctuations within the triangle.
4. Profit Targets
Use the triangle’s height at its thickest point to estimate profit targets.
By adding or subtracting this height from the breakout price, traders can approximate the potential price movement after the breakout.
Limitations and False Breakouts
It’s important to note that false breakouts can occur with ascending triangles.
A false breakout happens when the price briefly moves beyond the trendlines but fails to sustain the momentum, resulting in a potential reversal or a continuation of the previous trend.
Traders should exercise caution and be prepared to adapt their strategies or redraw patterns if necessary to avoid premature entries or false signals.
The Difference Between Ascending and Descending Triangles
While ascending triangles have a rising lower trendline and a horizontal upper trendline, descending triangles exhibit the opposite characteristics.
Both patterns are continuation patterns, but they have distinct visual differences.
Traders should familiarise themselves with these patterns to differentiate between potential bullish and bearish signals.
The Final Word on Ascending Triangle Patterns
Mastering the art of ascending triangle patterns can give forex traders valuable insights and enhance their trading skills.
By understanding the characteristics of ascending triangles, recognising their significance, and implementing effective trading strategies, traders can potentially identify profitable opportunities in the forex market.
With practice, observation, and continuous learning, traders can navigate the ever-changing landscape of forex trading and leverage ascending triangles to their advantage.
For more trading term general definitions, visit our A to Z of Forex Trading
What to do Next
If you have more questions or need further guidance, don’t hesitate to reach out to us at The Trading Coach International for personalized coaching and support.
If you would like to learn more about trading forex profitably and what steps you can take next to get on the right track to build your Lifestyle Income From Trading, you can book an no obligation, Free Strategy Call with our Lead Trading Coach by clicking on THIS LINK
Disclaimer
The information, strategies, techniques and approaches discussed in this article are for general information purposes only and studies of potential options. The Trading Coach International does not necessarily use, promote nor recommend any strategies discussed in this article. The information in this article may not be suitable for your personal financial circumstances and you should seek independent qualified financial advice before implementing any financial strategy. The Trading Coach International is not a financial advisor and does not have AFS registration.