


Forex Trading Bar Charts: A Trader’s Guide
In the world of forex trading, bar charts are popular and widely used tools for analysing price movements and making informed trading decisions.
Bar charts provide traders with essential information such as the opening price, closing price, high price, and low price over a specific time period.
This guide will explore the concept of forex trading bar charts, their components, how to interpret them, and their significance in the forex market.
By mastering the art of reading bar charts, traders can enhance their technical analysis skills and improve their trading outcomes.
Understanding Forex Trading Bar Charts
Forex trading bar charts are graphical representations of price movements over a given period.
They consist of individual bars that provide vital information about the price action during that period.
Each bar on the chart represents a specific time frame, ranging from minutes to months, depending on the trader’s preference and trading style.
Components of Forex Trading Bar Charts
Forex trading bar charts consist of several components that traders must understand to interpret correctly.
Here are the key elements:
Open Price
The open price represents the first price at which a financial instrument, such as a currency pair, is traded during the specified time period.
A horizontal tick mark denotes it on the left side of the bar.
Close Price
The close price represents the last price at which a financial instrument is traded during the specified time period.
A horizontal tick mark denotes it on the right side of the bar.
High Price
The high price represents the highest price reached by the financial instrument during the specified time period.
It is denoted by the top of the vertical line extending from the bar.
Low Price
The low price represents the lowest price reached by the financial instrument during the specified time period.
It is denoted by the bottom of the vertical line extending from the bar.
Bar Body
The bar body represents the price range between the open and close prices.
It is visually represented by a vertical rectangle or “bar.”
The bar’s colour can vary, typically green or white for a bullish bar (close price higher than open price) and red or black for a bearish bar (close price lower than open price).
Bar Length
The length of the bar represents the price range between the high and low prices.
A longer bar indicates greater price volatility, while a shorter bar suggests relatively lower volatility.
Interpreting Forex Trading Bar Charts
To effectively interpret forex trading bar charts, traders need to analyse the patterns and formations that occur. Here are some key aspects to consider when analysing bar charts:
Trend Identification
Bar charts can help traders identify the prevailing trend in the market.
In an uptrend, bullish bars (green or white) tend to dominate, with higher closes and lower opens. In a downtrend, bearish bars (red or black) are more prevalent, characterised by lower closes and higher opens.
Support and Resistance Levels
Bar charts can also assist in identifying support and resistance levels.
Support levels are price levels at which buying pressure exceeds selling pressure, preventing the price from declining further.
On the other hand, resistance levels are price levels at which selling pressure exceeds buying pressure, preventing the price from rising further.
These levels can be identified by observing patterns of bullish and bearish bars around specific price levels.
Price Patterns and Formations
Bar charts reveal various price patterns and formations that traders can use to gain valuable insights into future price movements.
These patterns include double tops and bottoms, head and shoulders, triangles, and more.
Traders can utilise these patterns to anticipate potential reversals, breakouts, or continuation of trends.
Volatility Analysis
The length of the bars on the chart reflects the market’s volatility.
Longer bars indicate higher volatility, while shorter bars indicate lower volatility.
Traders can use this information to assess the market conditions and adjust their trading strategies accordingly.
Significance of Forex Trading Bar Charts
Forex trading bar charts hold significant importance for traders.
Here’s why they are widely utilised in the forex market:
Historical Price Analysis
Bar charts provide a historical record of price movements, allowing traders to analyse past market behaviour.
By studying historical price patterns and formations, traders can identify recurring patterns and make more informed trading decisions.
Technical Analysis
Bar charts are a recognised tool in technical analysis, which focuses on studying price movements and patterns to predict future price behaviour.
Traders use various technical indicators alongside bar charts to gain deeper insights into market trends, momentum, and potential reversals.
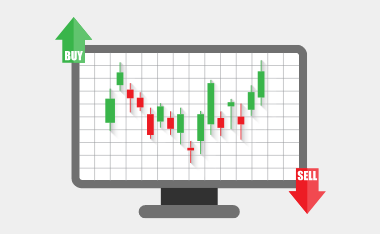
Entry and Exit Points
Bar charts assist traders in determining optimal entry and exit points for their trades.
By analysing the patterns and formations on the chart, traders can identify potential entry opportunities when the price confirms a reversal or breakout.
Similarly, they can determine exit points by observing signs of trend exhaustion or when the price reaches a predetermined target.
Risk Management
Bar charts provide crucial information for effective risk management.
Traders can set stop-loss orders based on key support and resistance levels identified on the chart.
This helps protect against significant losses if the price moves against their positions.
Bar Charts in Bearish Markets
In bearish markets, where selling pressure outweighs buying pressure, bar charts provide valuable insights into the price dynamics and help traders navigate the downward trend.
Here’s how bar charts can be interpreted in bearish markets:
Bearish Bar Characteristics
In a bearish market, most bars on the chart are bearish, typically represented by red or black bars.
These bars indicate that the closing price is lower than the opening price, suggesting a negative sentiment among traders.
The length of the bearish bars reflects the extent of the price decline, with longer bars indicating stronger selling pressure and volatility.
Lower Highs and Lower Lows
When analysing bar charts in bearish markets, traders observe a pattern of lower highs and lower lows.
Lower highs indicate that the price fails to reach previous highs, showing diminishing buying interest.
Lower lows reflect the continuous downward pressure as sellers push the price to new lows.
Resistance Levels
Bar charts in bearish markets often reveal key resistance levels where selling pressure intensifies.
These levels are characterised by clusters of bearish bars, indicating that sellers are actively entering the market and preventing the price from rising.
Traders can use these resistance levels to plan short-selling strategies or set profit targets for their bearish trades.
Breakouts and Reversals
Bar charts in bearish markets can also provide insights into potential breakout or reversal opportunities.
Traders observe patterns such as bearish chart patterns (e.g., head and shoulders, descending triangles) or extended periods of consolidation followed by a breakdown.
These patterns can signal further downward momentum or potential trend reversals, prompting traders to adjust their positions accordingly.
Bar Charts in Bullish Markets
Bar charts help traders identify upward trends and capitalise on profitable opportunities in bullish markets, where buying pressure dominates.
Here’s how bar charts can be interpreted in bullish markets:
Bullish Bar Characteristics
In a bullish market, most bars on the chart are bullish, typically represented by green or white bars.
These bars indicate that the closing price is higher than the opening price, signalling positive sentiment and strong buying interest.
The bullish bars’ length reflects the price increase’s magnitude, with longer bars indicating stronger buying pressure and volatility.
Higher Highs and Higher Lows
When analysing bar charts in bullish markets, traders observe a pattern of higher highs and higher lows.
Higher highs indicate that the price surpasses previous highs, demonstrating increasing buying interest and bullish momentum.
Higher lows reflect the upward pressure as buyers step in at higher price levels, preventing significant price declines.
Support Levels
Bar charts in bullish markets often reveal key support levels where buying interest is concentrated.
These levels are characterised by clusters of bullish bars, indicating strong demand and support for the price.
Traders can use these support levels to plan long positions or set stop-loss orders to protect against potential downturns.
Breakouts and Continuations
Bar charts in bullish markets can also provide insights into potential breakout or continuation opportunities. Traders observe bullish chart patterns (e.g., ascending triangles, double bottoms) or periods of consolidation followed by a breakout to new highs.
These patterns signal continuing upward momentum or the continuation of the existing trend, allowing traders to ride the trend and maximise their profits.
By understanding the characteristics and interpreting bar charts in bearish and bullish markets, traders can effectively gauge market sentiment, identify key support and resistance levels, and make informed trading decisions.
Whether trading in bearish or bullish conditions, bar charts are invaluable tools for analysing price movements and capitalising on opportunities in the forex market.
Forex Trading Bar Charts vs. Forex Candlestick Charts
In the world of forex trading, bar charts and candlestick charts are two popular charting methods used to analyse price movements.
Both charts provide valuable information about market trends and price patterns.
Still, they differ in presentation and the level of detail they offer.
Let’s explore the comparison between Forex bar charts and Forex candlestick charts, including the growing popularity of candlestick charts among modern Forex traders.
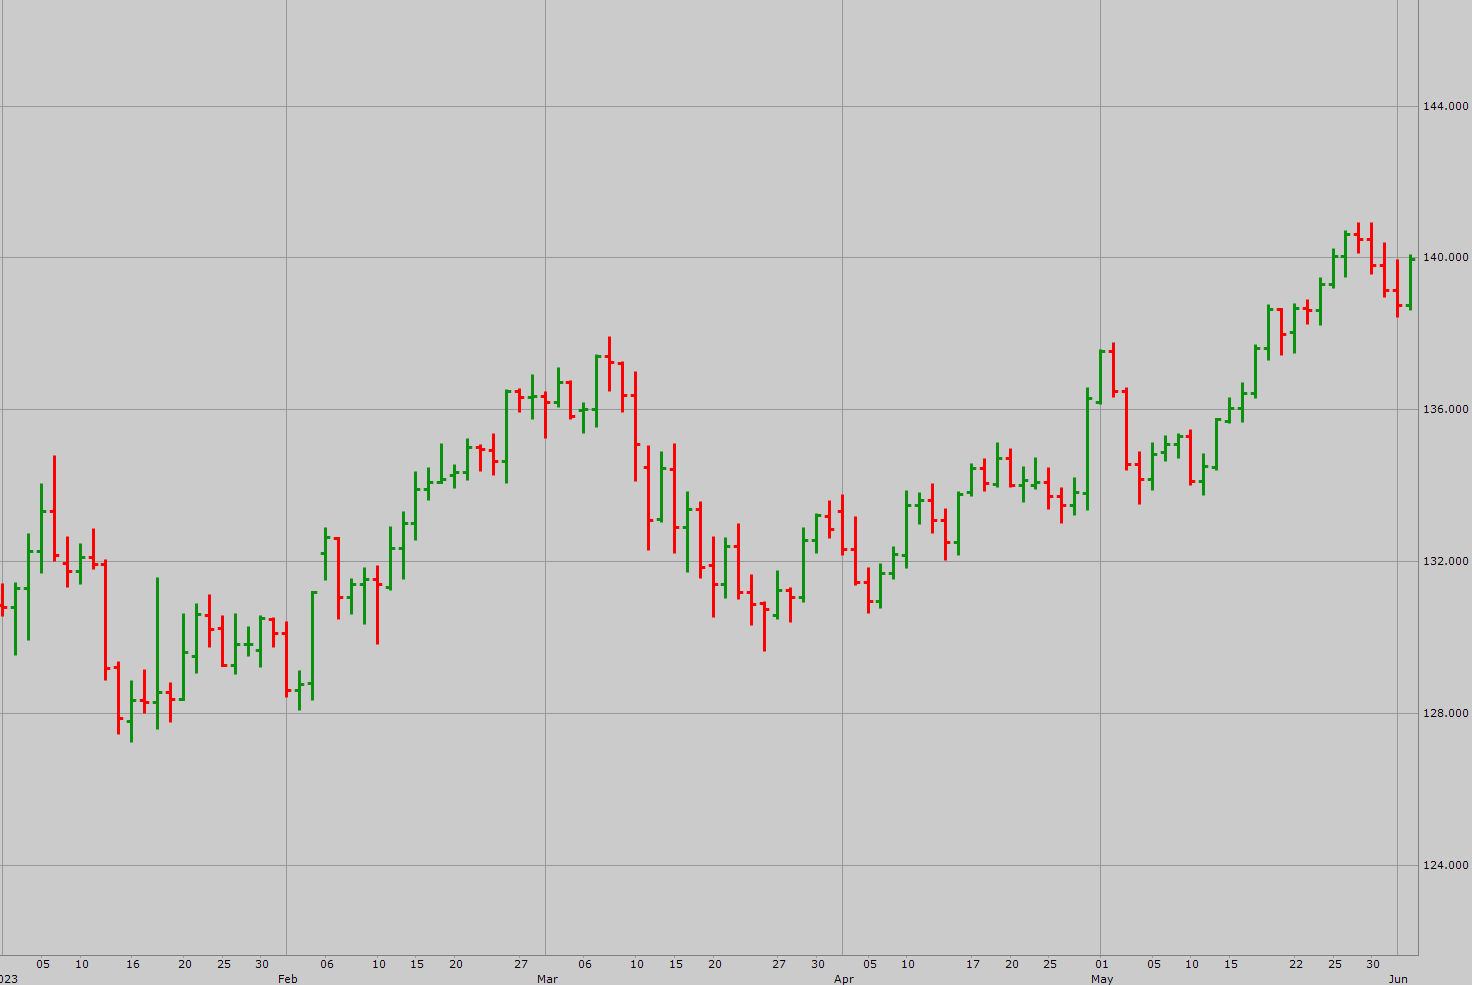
Forex Bar Charts
Forex bar charts are one of the oldest and most traditional methods of visualising price data.
They consist of a series of vertical bars, each representing a specific time period, such as a day, an hour, or even a minute.
The vertical bars are composed of four main elements: the high, the low, the opening price, and the closing price.
The top of the bar represents the high, while the bottom represents the low.
The opening price is denoted by a small horizontal tick on the left side of the bar, and a small horizontal tick on the right side of the bar represents the closing price.
Forex bar charts provide essential information about the price range, volatility, and closing prices for a given time period.
They are very useful in technical analysis, allowing traders to identify price levels of support and resistance, trend reversals, and price patterns.
Bar charts are known for their simplicity and clarity, making them a popular choice for traders who prefer a straightforward representation of price data.
Forex Candlestick Charts
Forex candlestick charts originated in Japan in the 18th century and have gained widespread popularity among modern forex traders.
Candlestick charts provide more visual information than bar charts, making them highly informative and visually appealing.
Each candlestick represents a specific time period and consists of a body and two wicks, also known as shadows or tails.
The candlestick’s body represents the price range between the opening and closing prices.
If the closing price of the period is higher than its opening price, the body is typically filled or coloured, indicating a bullish or positive price movement.
On the other hand, if the closing price of a period is lower than its opening price, the body is usually hollow or coloured differently, indicating a bearish or negative price movement.
The wicks of the candlestick represent the price range between the high and low for the given time period.
The upper wick extends from the top of the body and represents the high, while the lower wick extends from the bottom of the body and represents the low.
Candlestick charts offer a wide range of patterns and formations that help traders identify trends, reversals, and market sentiment.
Patterns like doji, engulfing, hammer, and shooting star provide valuable insights into potential price movements and market dynamics.
Candlestick charts excel in capturing the psychological aspects of price action, enabling traders to interpret market sentiment and make more informed trading decisions.
The popularity of Candlestick Charts
Candlestick charts have gained significant popularity among modern forex traders for several reasons.
Firstly, candlestick charts provide a visual representation of price data that is both informative and easy to interpret.
The patterns and formations on candlestick charts offer insights into market sentiment and potential price reversals, allowing traders to spot profitable trading opportunities.
Secondly, candlestick charts offer a comprehensive view of price action, capturing both the range and direction of price movements.
The visual representation of bullish and bearish candlesticks, along with their various patterns, aids in the identification of trend continuations, reversals, and the overall market condition.
Lastly, candlestick charts have become widely accessible through modern trading platforms and charting software.
Traders can easily customise their candlestick charts, apply technical indicators, and overlay additional analysis tools to enhance their trading strategies.
As a result of their informative nature and ease of use, candlestick charts have become the preferred choice for many forex traders.
They provide a powerful visual tool that complements technical analysis and aids in making well-informed trading decisions.
The Last word on Forex Trading Bar Charts
Forex trading bar charts are powerful tools that provide traders with essential information about price movements and patterns in the forex market.
By understanding the components of bar charts and interpreting them correctly, traders can gain valuable insights into market trends, identify support and resistance levels, and make informed trading decisions.
Both forex trading Bar Charts and Candlestick Charts are significant in technical analysis, assisting traders in historical price analysis, trend identification, and risk management.
They enable traders to identify entry and exit points based on price patterns and formations.
With practice and observation, traders can master the art of reading bar charts and increase their chances of success in the dynamic world of forex trading.
While both forex bar charts and forex candlestick charts offer valuable insights into price movements and market trends, candlestick charts have gained popularity among modern forex traders due to their visual appeal, comprehensive representation of price data, and ability to capture the market sentiment.
By understanding the differences between these chart types, traders can choose the charting method that best suits their trading style and preferences, ultimately enhancing their ability to effectively analyse and navigate the forex market.
More Information
For more trading term general definitions, visit our A to Z of Forex Trading
To look at these concepts in action, please visit our sister site, Latest Forex Rates
What to do Next
If you have more questions or need further guidance, don’t hesitate to reach out to us at The Trading Coach International for personalized coaching and support.
If you would like to learn more about trading forex profitably and what steps you can take next to get on the right track to build your Lifestyle Income From Trading, you can book an no obligation, Free Strategy Call with our Lead Trading Coach by clicking on THIS LINK
Disclaimer
The information, strategies, techniques and approaches discussed in this article are for general information purposes only and studies of potential options. The Trading Coach International does not necessarily use, promote nor recommend any strategies discussed in this article. The information in this article may not be suitable for your personal financial circumstances and you should seek independent qualified financial advice before implementing any financial strategy. The Trading Coach International is not a financial advisor and does not have AFS registration.