


Forex Trading and Japanese Candlestick Charts
Unlocking the Secrets of Forex Trading: The Art and Science of Japanese Candlestick Charts
In the dynamic world of forex trading, where decisions are made in the blink of an eye, understanding the tools at your disposal is crucial.
Among these tools, Japanese candlestick charts stand out as a time-tested and insightful method for analyzing price movements.
In this article, we will delve into the history of Japanese candlestick charts, explore their applications in forex trading, and uncover the numerous benefits they offer to both novice and experienced traders.
The Origins of Japanese Candlestick Charts
The roots of Japanese candlestick charts trace back to 18th-century Japan, where they were initially developed by a rice trader named Munehisa Homma.
Homma, often regarded as the father of candlestick charting, used these charts to track the price movements of rice in the Dojima Rice Exchange.

Over time, the candlestick charting method evolved and gained popularity, eventually finding its way into the realm of forex trading.
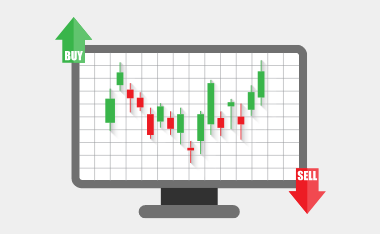
The essence of Japanese candlestick charts lies in their ability to visually represent price data.
Each candlestick provides a snapshot of the market’s sentiment during a specific time period, typically ranging from minutes to days.
The two main components of a candlestick are the body and the wicks, also known as shadows.
The body represents the opening and closing prices, while the wicks indicate the highest and lowest prices reached during the time period.
Decoding Japanese Candlestick Charts and Patterns
One of the primary advantages of Japanese candlestick charts is their capacity to reveal patterns that can signal potential market movements.
Various candlestick patterns have been identified over the years, each with its own unique implications.
Novice traders can significantly benefit from learning some of the basic candlestick patterns to enhance their ability to interpret market behaviour.
- Doji: A Doji occurs when the opening and closing prices are virtually the same, creating a small or non-existent body. This pattern suggests indecision in the market and may precede a reversal.
- Engulfing Pattern: This occurs when a large candlestick “engulfs” the previous one. A bullish engulfing pattern signals a potential upward reversal, while a bearish engulfing pattern suggests the opposite.
- Hammer and Hanging Man: These patterns are characterized by a small body and a long lower wick. A hammer occurs after a downtrend and implies a potential reversal to the upside, while a hanging man occurs after an uptrend, signaling a potential reversal to the downside.
- Morning Star and Evening Star: These are three-candle reversal patterns. The morning star, appearing after a downtrend, signals a potential bullish reversal. Conversely, the evening star, appearing after an uptrend, suggests a potential bearish reversal.
Japanese Candlestick Charts: Their Application in Forex Trading
Japanese candlestick charts have become an integral part of forex trading due to their effectiveness in providing valuable insights into market dynamics.
Traders use these charts to identify trends, reversal points, and potential entry and exit signals.
Let’s explore how candlestick charts are applied in the context of forex trading.
- Trend Identification: By observing the sequence of candlesticks, traders can quickly identify the prevailing trend in the market. An uptrend is characterized by a series of higher highs and higher lows, while a downtrend exhibits lower highs and lower lows.
- Reversal Signals: Candlestick patterns, as mentioned earlier, offer powerful signals for potential trend reversals. Recognizing these patterns can help traders make informed decisions to enter or exit positions.
- Support and Resistance Levels: The wicks of candlesticks provide valuable information about price extremes. Long lower wicks indicate strong buying interest, potentially forming support levels, while long upper wicks suggest selling pressure and potential resistance levels.
- Confirmation with Other Indicators: Candlestick charts are often used in conjunction with other technical indicators to strengthen trading decisions. Combining candlestick patterns with tools like moving averages or relative strength index (RSI) can enhance the accuracy of predictions.
Benefits of Japanese Candlestick Charts in Forex Trading
Embracing Japanese candlestick charts in your forex trading strategy can offer a multitude of benefits, especially for those just starting their trading journey.
- Visual Clarity: The visual representation of price data in candlestick charts provides a clearer and more intuitive understanding of market sentiment. Traders can quickly assess the relationship between opening, closing, high, and low prices for a given time period.
- Easy-to-Learn: Unlike some complex technical indicators, candlestick charts are relatively easy to understand, making them accessible to traders of all experience levels. Learning a few key patterns can significantly enhance a trader’s ability to interpret market movements.
- Versatility: Japanese candlestick charts can be applied to various time frames, from short-term intraday trading to longer-term swing trading or investing. This versatility allows traders to adapt their strategies based on different market conditions.
- Incorporating Psychology: Candlestick patterns incorporate psychological aspects of market behaviour. Understanding the emotions driving market participants can help traders anticipate potential price movements and make more informed decisions.
The Final Word on Forex Trading Using Japanese Candlestick Charts
Japanese candlestick charts, with their rich history and proven effectiveness, stand as a powerful tool for forex traders seeking to navigate the complexities of the financial markets.
By mastering the art of interpreting candlestick patterns, traders can gain valuable insights into market sentiment, identify trends, and make informed decisions.
Whether you’re a novice trader looking to build a solid foundation or an experienced trader seeking to refine your strategies, Japanese candlestick charts offer a time-tested and versatile approach to analysing price movements in the ever-evolving world of forex trading.
More Information
For more trading term general definitions, visit our A to Z of Forex Trading
To look at these concepts in action, please visit our sister site, Latest Forex Rates
What to do Next
If you have more questions or need further guidance, don’t hesitate to reach out to us at The Trading Coach International for personalized coaching and support.
If you would like to learn more about trading forex profitably and what steps you can take next to get on the right track to build your Lifestyle Income From Trading, you can book an no obligation, Free Strategy Call with our Lead Trading Coach by clicking on THIS LINK
Disclaimer
The information, strategies, techniques and approaches discussed in this article are for general information purposes only and studies of potential options. The Trading Coach International does not necessarily use, promote nor recommend any strategies discussed in this article. The information in this article may not be suitable for your personal financial circumstances and you should seek independent qualified financial advice before implementing any financial strategy. The Trading Coach International is not a financial advisor and does not have AFS registration.