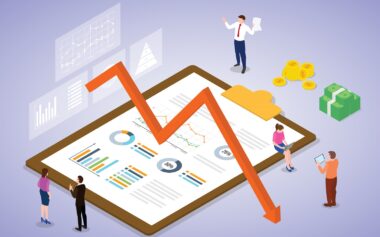


Use Australian Broker Tools to Track Your Trading Progress Like a Pro
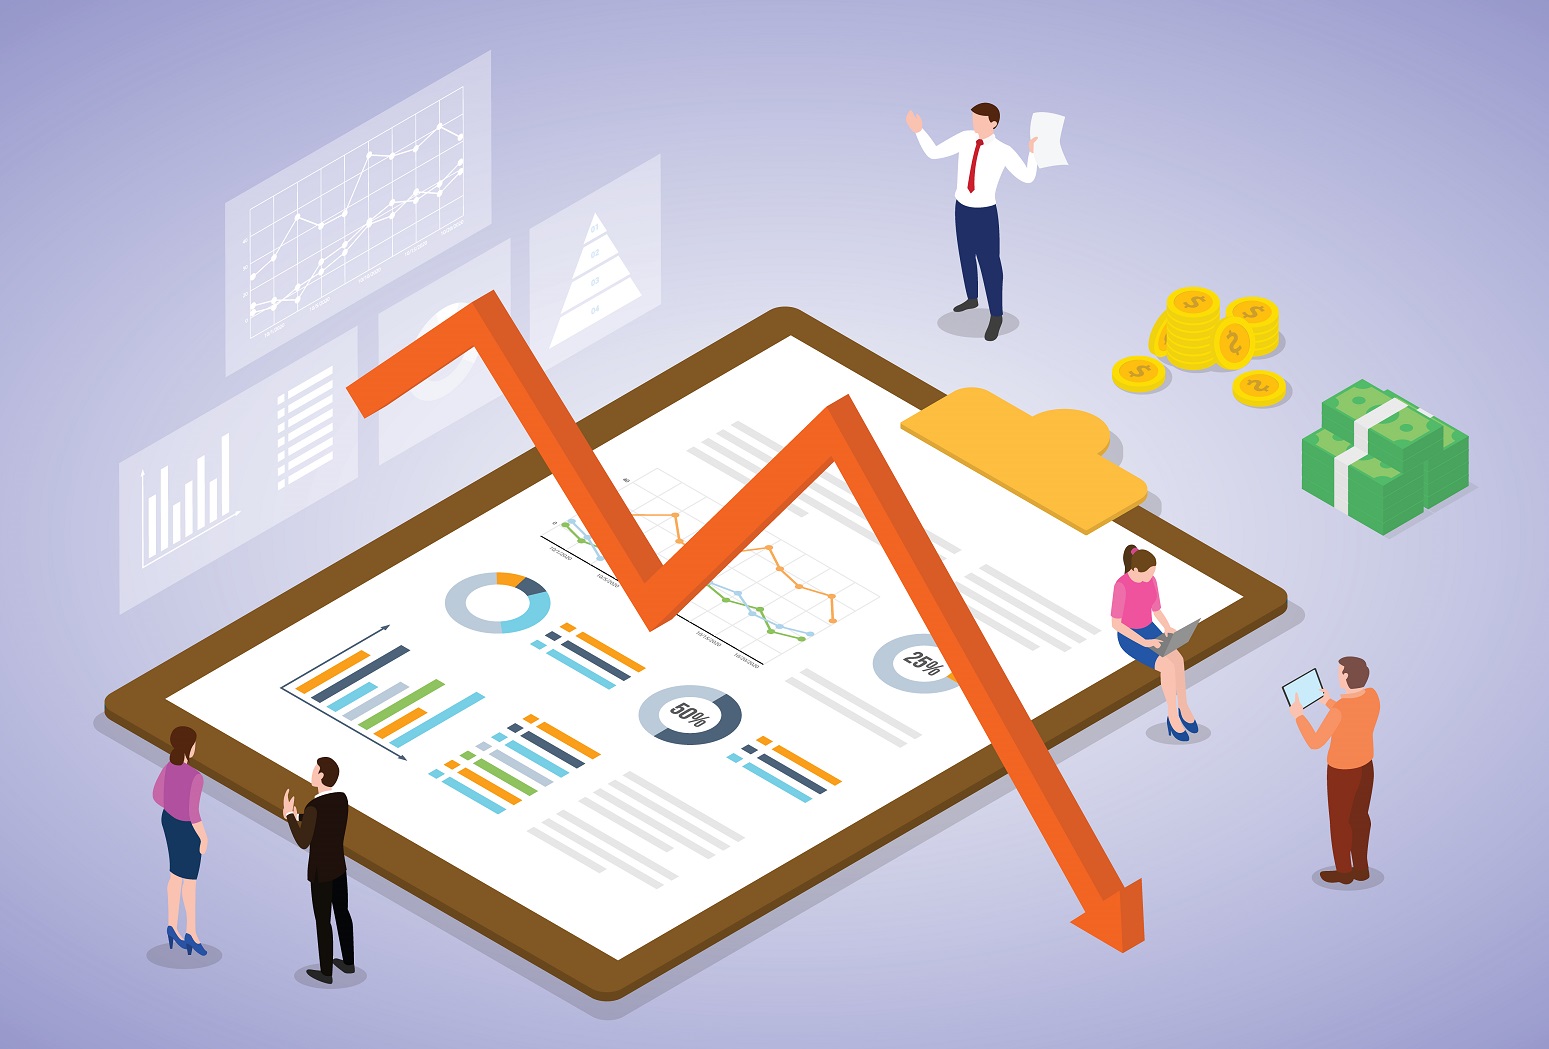
Tracking your trading performance is the difference between guessing your way through markets and trading with true professional insight.
For Australian forex traders, the tools provided by ASIC-regulated brokers offer an unparalleled advantage – if you know how to use them properly.
This isn’t just about checking your profit and loss statement; it’s about developing a forensic understanding of your trading habits, risk exposure, and strategic strengths.
Why Tracking Performance Separates Winners From the Pack
The brutal truth about forex trading is that 80% of retail traders lose money.
The 20% who succeed share one common trait – they treat trading as a business, not a gamble.
This means meticulous performance tracking, constant review, and data-driven adjustments.
Your broker’s analytics tools provide the hard evidence you need to break through plateaus in your trading.
Consider this: two traders might both be marginally profitable over six months.
The trader who religiously tracks their metrics will know their exact win rate (say 42%), average winner ($85) vs average loser ($53), and which currency pairs account for 80% of their profits.
The untracked trader just knows they’re “doing okay.”
When market conditions change (as they inevitably do), guess who adapts faster?
ASIC’s Role in Ensuring Quality Broker Tools
Australia’s financial regulator, ASIC, mandates that licensed brokers provide clients with transparent trading data and risk management tools.
This isn’t just bureaucratic box-ticking – these requirements force brokers to develop sophisticated analytics that rival institutional-grade systems.
Under ASIC Regulatory Guide 267, brokers must:
- Provide accurate, real-time trade reporting
- Offer clear risk warnings and exposure calculations
- Maintain complete transaction records
- Supply clients with performance statements
The result? Australian traders access tools that many international traders would pay thousands for – included free with their trading account.
The Trader’s Toolkit: Essential Features You Should Be Using
Advanced Trade Analytics
The best ASIC brokers offer analytics that would make a hedge fund manager envious. We’re talking about:
- Win Rate Analysis: Not just overall percentage, but broken down by:
- Currency pair (are you better on AUD/USD or EUR/JPY?)
- Time of day (do your London session trades outperform Sydney session?)
- Trade duration (are your 15-minute scalps more successful than 4-hour swings?)
- Profit Factor Scoring: This critical metric (gross wins/gross losses) reveals whether your strategy is fundamentally sound. A score below 1.0 means you’re losing money long-term, even if some months feel profitable.
- Strategy Heat Maps: Visual representations showing exactly which chart patterns or setups work best for you. Maybe your pin bar entries crush it on GBP/USD but fail miserably on USD/JPY.
Risk Exposure Monitors
Sophisticated brokers provide real-time risk dashboards tracking:
- Portfolio Beta: How correlated your open positions are. Having three AUD pairs open isn’t diversification – it’s concentration risk.
- Margin Efficiency: Are you over-leveraging certain account segments?
- Scenario Testing: “What if” modeling showing how your account would handle a 100-pip USD surge or RBA rate shock.
Custom Performance Benchmarking
Top-tier platforms let you set custom benchmarks like:
- “Outperform the AUD/USD daily range 60% of the time”
- “Maintain a 1.8+ profit factor on all Asian session trades”
- “Keep max drawdown below 8% monthly”
These transform vague goals into measurable targets.
Building Your Tracking Routine: A Step-By-Step Guide
Daily: The 10-Minute Review
- Trade Journal Snapshot: Most broker platforms now auto-populate journals. Before trading, scan yesterday’s trades – any patterns in losing positions?
- Economic Calendar Alignment: Check your broker’s economic impact overlay. Did news events disproportionately affect your results?
- Session Analytics: Quick glance at your win rates by trading session (Sydney/London/NY).
Weekly: The Deep Dive
- Strategy Performance Report: Run your broker’s strategy analyzer. Which setups worked? Which failed?
- Time Analysis: Are you wasting hours in low-probability trading windows?
- Instrument Report: Should you drop EUR/GBP if AUD/NZD yields 3x better returns?
Monthly: The Business Review
- Profit Factor Trend: Is it improving or degrading month-on-month?
- Risk-Adjusted Returns: Compare your Sharpe Ratio progression.
- Cost Analysis: How much are spreads/commissions eating into profits?
Real-World Application: An AUD Trader’s Breakthrough
Consider Sarah, a Melbourne-based trader struggling with consistency. By diving into her broker’s analytics, she discovered:
- Her AUD/JPY trades had a 1.9 profit factor vs 0.7 on EUR/AUD
- Trades taken between 2-4pm Sydney time lost 62% of the time
- Her average winner was 1.8x her average loser – but she was exiting winners too early
Three months of data-driven adjustments saw her account grow 27% – not by changing her strategy, but by focusing on what actually worked.
The 2025 Edge: Emerging Tools to Watch
Forward-thinking brokers are rolling out:
- AI Trade Assistants: Machine learning that flags recurring mistakes
- Emotional Scoring: Algorithms detecting tilt trading patterns
- Correlation Guards: Automatic warnings when positions become too similar
Your Action Plan
- Audit Your Tools: Does your broker provide these analytics? If not, it’s upgrade time.
- Schedule Reviews: Block calendar time for data analysis – treat it like a business meeting.
- Start Small: Focus on one metric (maybe profit factor) for a month before expanding.
- Benchmark Progress: Set quarterly improvement targets (e.g., “Increase win rate by 5%”).
Remember: The difference between a struggling trader and a successful one isn’t necessarily skill – it’s often just better self-awareness.
Your broker’s tools provide the mirror; you just need to look into it regularly.
Disclaimer
The information, strategies, techniques and approaches discussed in this article are for general information purposes only. The Trading Coach International does not necessarily use, promote nor recommend any strategies discussed in this article. The information in this article may not be suitable for your personal financial circumstances and you should seek independent qualified financial advice before implementing any financial strategy. The Trading Coach International is not a financial advisor and does not have AFS registration.