


How Dojis Can Help You Identify Price Reversals…
Why These Weird Candles Matter to Smart Traders
If you’re just getting started with trading, you’ve probably heard about candlestick patterns.
They can seem confusing at first, but learning them can give you an edge.
One of the most important and easiest patterns to recognise is the Doji candlestick.
Let’s break it down in plain English so you can start using it on your charts today—and more importantly, so you understand what it means, when it matters, and when to be cautious.
What Is a Doji?
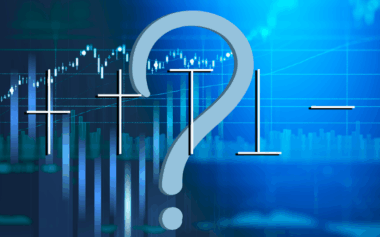
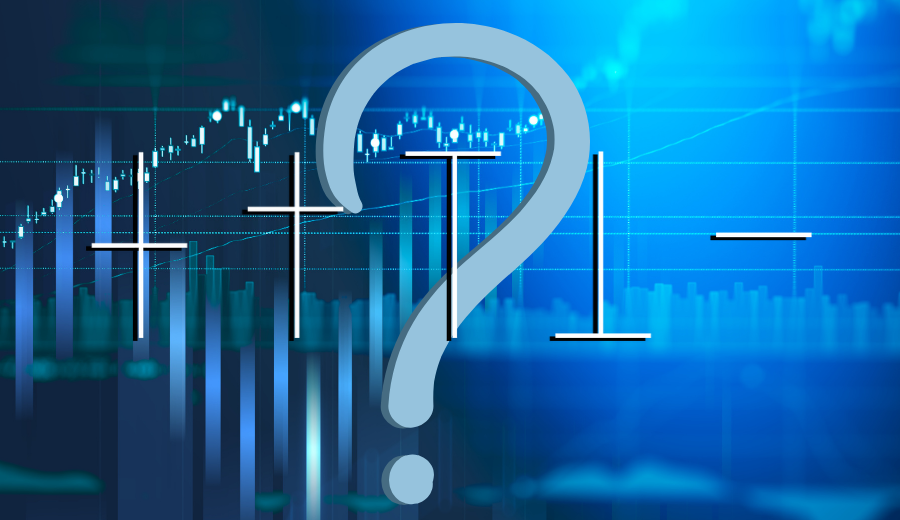
A Doji candlestick is a candle that forms when the market opens and closes at nearly the same price during a trading session.
On your chart, it usually looks like a cross or plus sign.
This pattern means the bulls and bears are in balance—nobody is clearly winning the battle.
Here’s what that might tell you:
- Buyers pushed the price up, but couldn’t keep it there
- Sellers pushed the price down, but couldn’t hold it either
- By the close, the price returned to where it started
This tells us the market is uncertain. It could be preparing to reverse, pause, or explode in either direction.
But here’s the key—context is everything.
Types of Doji Candles
There are several kinds of Doji candlesticks.
They all share one thing: a small or non-existent body (meaning open ≈ close). But they have different wick shapes.
Here are the most common types:
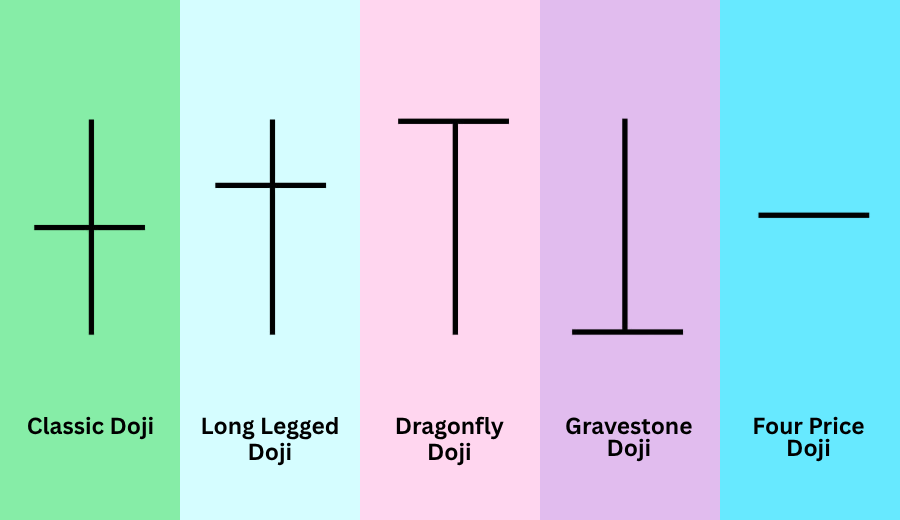
1. Standard Doji
Looks like a cross. Open and close are nearly equal, and wicks are of similar length on both ends. It shows indecision.
2. Long-Legged Doji
Same as a standard Doji but with longer wicks. It tells you there was a lot of movement in both directions during the session, but it still closed near the open.
Stronger sign of uncertainty or potential reversal.
3. Dragonfly Doji
Flat at the top with a long lower wick. Sellers had control early, but buyers pushed the price back up.
This can be a bullish signal at the bottom of a trend.
4. Gravestone Doji
Flat at the bottom with a long upper wick. Buyers were strong during the session but gave up all gains.
This can be a bearish signal at the top of a trend.
Understanding these types helps you respond to what the market is trying to tell you.
It’s not about prediction—it’s about reading clues.
Where Do Doji Candles Matter Most?
A Doji is just a shape unless you look at where it appears on your chart.
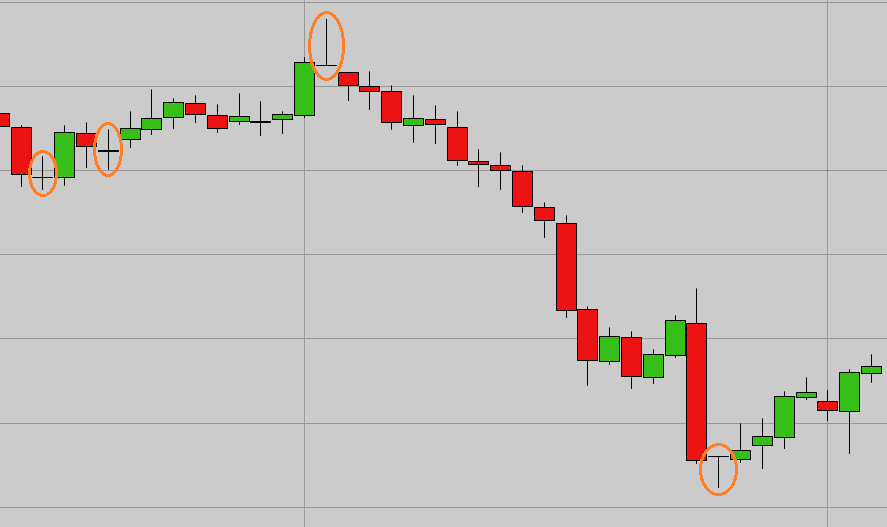
At the Top of a Trend
If the market has been moving up for a while and you see a Doji, especially a Gravestone Doji, it may signal that buying pressure is weakening.
This doesn’t mean the market will crash, but it’s a sign to tighten stops or look for confirmation of a reversal.
At the Bottom of a Trend
If the market has been falling and you see a Dragonfly Doji, it might mean the sellers are losing steam.
Buyers may be stepping back in. Again, you’ll want confirmation—such as a strong bullish candle afterward.
In a Range or Sideways Market
In this case, a Doji might not mean much at all. When the market is going nowhere, Dojis are common.
Don’t overreact to every one you see. Look for them at key support and resistance levels instead.
What a Doji Can’t Tell You
Here’s where new traders often go wrong: they see a Doji and expect a trend to reverse straight away.
The truth is, a Doji is not a guarantee of anything.
It’s a signal of indecision, not a signal of direction.
By itself, it won’t tell you where price is going next.
You always need to look at:
- The trend before the Doji
- The volume (high volume makes it more reliable)
- The next candle (confirmation is key)
- The bigger picture (daily support/resistance, news events, etc.)
Without this context, you’re just guessing.
Real-Life Example
Let’s say AUD/USD has been rising for several days, and you’re watching the 1-hour chart.
Suddenly, a Gravestone Doji forms right at a known resistance level from the previous week.
This could be a warning sign. You wait for the next candle, and it’s a strong bearish engulfing bar.
That’s a signal you might use to short the market—with a stop above the high of the Doji and a target down at the next support zone.
This is smart trading. You’re not guessing—you’re responding to what price is telling you.
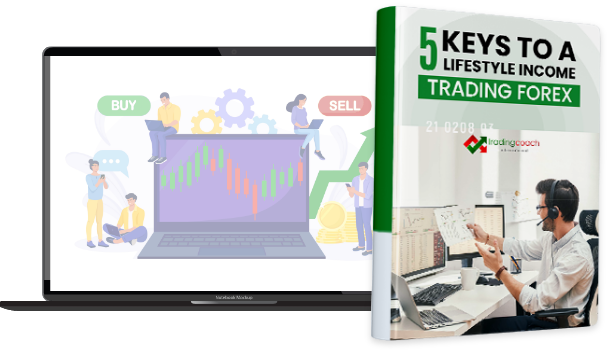
Why We Teach Candlesticks First in LIFT
At The Trading Coach, our LIFT programs start with simple tools like candlestick patterns… not because they’re “magical“, but because they train your eyes to read the story behind the price.
But here’s what separates our students from struggling traders…
We don’t stop at technicals.
We teach:
- How to confirm signals with structure, zones, and volume
- When to ignore a signal if the market conditions don’t suit
- Why your mindset affects how you react to candles like the Doji
- How to build rules-based systems, so you’re not chasing trades
Many traders lose money not because they don’t know patterns—but because they don’t know how to use them in a full strategy.
That’s where LIFT Flex, LIFT Pro, and LIFT Pro Plus come in.
Wrapping Up
The Doji candlestick is one of the simplest and most powerful tools a trader can learn.
It doesn’t give you all the answers, but it asks the right questions. It makes you pause, think, and prepare.
Use it with structure. Look for confirmation.
And always remember—being a consistently profitable trader is about more than knowing a few patterns.
If you’re serious about trading the right way, with a custom strategy and real support, check out our LIFT programs.
Whether you’re trading part-time or going pro, we’ll help you build a roadmap that works.
Disclaimer
Trading forex involves risk and may not be suitable for all investors. Past performance is not indicative of future results. Always conduct your own research before trading.
The information, strategies, techniques and approaches discussed in this article are for general information purposes only. The Trading Coach International does not necessarily use, promote nor recommend any strategies discussed in this article. The information in this article may not be suitable for your personal financial circumstances and you should seek independent qualified financial advice before implementing any financial strategy. The Trading Coach International is not a financial advisor and does not have AFS registration.