


What are the Best Forex Trading Candlestick Patterns?
Forex candlestick charts are the “go to” chart style for professional institutional traders and profitable retail traders alike.
Candlestick charts help forex traders develop their understanding of the pressures that drive price movement and; if used correctly, can help traders find better trade setups and predict the potential upcoming movement of price.
Candlestick patterns are typically used in technical analysis to identify trends in prices, potentially strong support and resistance levels, areas of consolidation and exhaustion and levels where price is more likely to continue or reverse.
Forex candlesticks are crucial when traders are learning to trade forex, and it’s highly beneficial for traders to be able to identify the key candlestick patterns that are most reliable and what exactly these forex candlestick patterns indicate.
Three points—the open, the close and the candle highs and lows (either real bodies or wicks) combine to form and create the candlestick.
When the close price of a candlestick is higher than its open price, the candlestick will most likely turn either green or white (depending on your chart settings).
When the close price of a candlestick is higher than the open price, the candlestick will most likely turn either red or black (depending on your chart settings).
Railway Track Patterns
The Railway tracks chart pattern is based on price action trading made up of two candlesticks of equal or almost equal length, both with shaven ends (no wicks) on both the top and the bottom of both candles.
The Railway Track pattern represents two equally opposite bullish and bearish candlesticks.
Bullish Railway Tracks

If the first candlestick is Bullish following a Bullish Price Movement, the second candlestick in the pattern will be Bearish.
Bearish Railway Tracks

If the first candlestick is Bearish following a Bullish Price Movement, the second candlestick in the pattern will be Bullish.
Railway tracks candlestick patterns indicate a trend reversal and should only be traded when the trader perceives the trend as a reversal, based upon their general trading strategy and confirming the pressure from their other indicators.
As mentioned, there are two variants of railway tracks, i.e., the Bullish railway tracks and the Bearish railway tracks.
The Bullish railway track pattern signals a reversal to the upside when they appear and show that the Bulls have wrestled the Bears who were previously in control of the price off their momentum.
On the flip side, the Bearish railway track pattern signals a reversal to the downside when they appear and show that the Bears have wrestled the market movement from the Bulls, who were previously in control of the price off their momentum.
However, railway tracks alone are not an adequate indicator of a highly likely price reversal.
The use of railway tracks should be with other technical points, such as the supply and demand zones and support and resistance levels, and other momentum shift indicators to confirm a trend reversal entirely.
Shooting Star Pattern
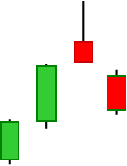
This is a Bearish reversal pattern that appears after prices have been constantly on the rise.
The sellers in this case are said to have overpowered the buyers, hence the reversal.
The body of a shooting star is made of a long upper wick / shadow, at least twice the length of the candle’s real body.
Currency Traders can use this forex candlestick pattern to identify the end of an upward trend, close their long positions and potentially prepare for a new Short Trade.
Some Traders could also use the pattern as a sell signal to open a Short Trade Position.
However, the candles that form after the shooting star should be the basis of confirmation as to whether there will be a trend reversal.
Until the Shooting Star candle has closed, the outcome is not written in stone.
Also, the Trader needs to consider how many pips are in the upper wick, as this can dramatically affect the size of their trade entry stop loss and the balance of their risk to reward ratio for that trade.
Currency traders should not rely solely on the Shooting Star pattern as the basis of execution of their trades but use it in combination with other patterns and indicators to ascertain the highest probability of direction and range of upcoming price movement.
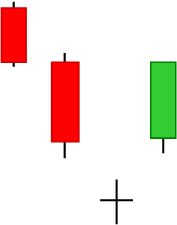
Abandoned Body Pattern
The abandoned body candlestick pattern is a three-candle pattern found on both Bearish and Bullish trends.
The abandoned body pattern consists of two large candles on either side of a separated doji middle candle.
It is used by currency traders as an indicator to enter or exit trades and occurs during a trend to indicate a potential trend reversal.
There are two variants of the abandoned body, the bullish abandoned body and the bearish abandoned body.
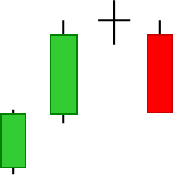
Bullish Abandoned Body
The Bullish abandoned body appears as a lead in to a Bullish trend, while the Bearish abandoned body appears as a lead in to a Bearish trend.
The anatomy of the Bullish abandoned body is a large Bearish candle followed by a Doji, with the third candle being a large Bullish candle.
This indicates the start of a potential Bullish trend reversal. The third candle being Green indicates the shift to a Bullish upcoming trend.
Bearish Abandoned Body
The bearish abandoned body pattern has the first candle as the green Bullish candle, the Doji in the middle and the third candle being the red Bearish candle.
To trade using the abandoned body candlestick pattern for a Bullish pattern, the trader should consider entering the trade above close price of the third (Bullish) candle.
For a Bearish pattern, a currency trader should enter the trade below the third (Bearish) candle.
To ensure that this is not just a short term aberration of price, the Trader should strengthen their entry by using this pattern in combination other strong forex patterns and signals to confirm direction and to define their potential profit targets.
Tweezer Bottoms Pattern
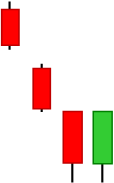
The Tweezer bottoms candlestick pattern, which presents as of two candlesticks with equal lows formed at the bottom of a downward trend, indicates a likely potential trend reversal to the upside.
The first candle of tweezer bottoms is that of the current trend, i.e. a red candle at the bottom of a bearish trend, while the second is a green bullish candle to identify a trend reversal.
When trading tweezer bottoms, ensure that both candles have closed. The entry candle should have opened above the second candle’s price low, indicating rejection of the support price.
It is generally ideal for traders to seek confirmation of a trend reversal using other strong Bullish indicators, before executing a trade using tweezer bottoms.
The appearance of the tweezer bottoms does not guarantee a trend reversal, as price may pause, potentially consolidate and then continue following the initial trend.
Tweezer Tops

Tweezer tops candlestick patterns are a bearish trend reversal and form after the price reaches a point of Resistance in the Markets, after price been on the rise, indicating an potential imminent price reversal to the downside.
The tweezer tops are two candlestick patterns that form equal or almost equal highs.
The first candle of the tweezer tops is a Bullish green candlestick, while the second is a red Bearish candlestick.
The bearish candlestick forms to negate the upward momentum and reject the Resistance price level.
To enter a trade using the tweezer tops as an indicator, the trader should enter the trade after the close the second candle, preferably with the open price of the entry candle being lower than the high of the previous candle.
Despite being a reversal pattern indicator offering a potential selling opportunity, tweezer tops patterns should ideally be used along with other strong Bearish indicators to confirm that it is a trend reversal, not a price pause or consolidation.
In Conclusion
Forex candlestick patterns are a powerful tool for currency traders to identify potential price movements and trends. Understanding the strongest candlestick patterns as traders learn to trade forex is integral for successful trading.
The proper knowledge of forex candlestick patterns allows traders to make informed decisions, develop consistency and ultimately build a profitable trading business.
However, candlesticks alone are not a solid trading strategy.
Different patterns can be more or less effective in different market conditions and for different trading strategies.
Therefore, for a robust and high probability Trading Strategy, they should be used in conjunction with other methods, such as top down analysis, trend analysis, key support and resistance levels and other strong indicators, to form a complete trading strategy.
This cohesive combination of tools within a high probability Trading Method will give traders a much better understanding of market movements and provide a clearer picture of potential trade entries and exits.
LIFT Investor Trader teaches Traders how to read candlestick patterns in combination with other strong proven analysis indicators in the LIFT Trading Method
More Information
For more trading term general definitions, visit our A to Z of Forex Trading
To look at these concepts in action, please visit our sister site, Latest Forex Rates
What to do Next
If you have more questions or need further guidance, don’t hesitate to reach out to us at The Trading Coach International for personalized coaching and support.
If you would like to learn more about trading forex profitably and what steps you can take next to get on the right track to build your Lifestyle Income From Trading, you can book an no obligation, Free Strategy Call with our Lead Trading Coach by clicking on THIS LINK
Disclaimer
The information, strategies, techniques and approaches discussed in this article are for general information purposes only and studies of potential options. The Trading Coach International does not necessarily use, promote nor recommend any strategies discussed in this article. The information in this article may not be suitable for your personal financial circumstances and you should seek independent qualified financial advice before implementing any financial strategy. The Trading Coach International is not a financial advisor and does not have AFS registration.